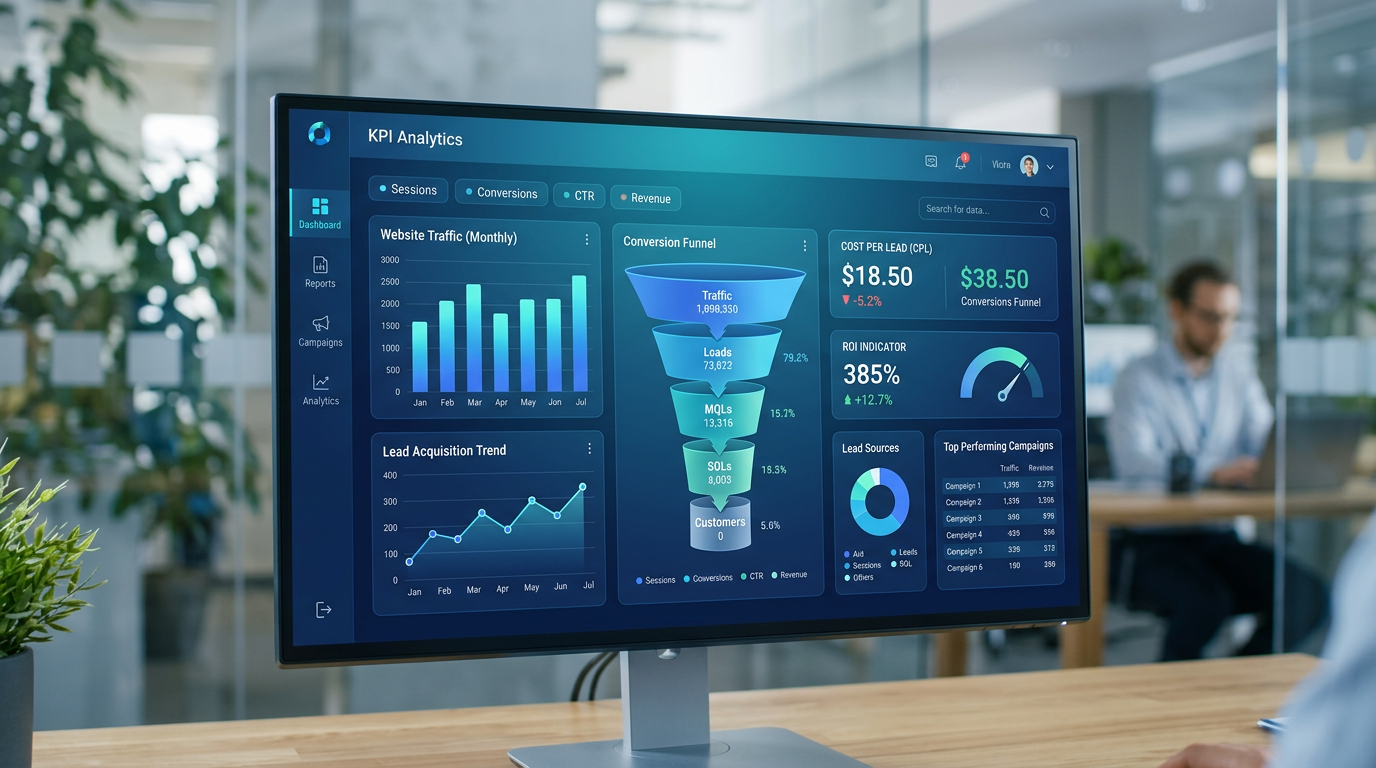
Without shared indicators, web marketing becomes a series of costly actions of which we do not know if they pay off. For an SME Alpilles or a service structure in PACA, profitability is seen in the link between media/creative spend, qualified leads and signed sales — not just in "likes" or raw sessions.
The essential KPIs on the dashboard
Start by distinguishing volume indicators (traffic, impressions) and value indicators (conversion rate, average basket of leads, cycle time). A web agency serious aligns the reporting with your business objectives: appointments made, quotes requested, newsletter registrations useful for nurture.
- Cost per lead (CPL) : marketing expenses ÷ number of attributable leads.
- Conversion rate by landing, by source (SEO, Ads, social).
- Customer lifetime value (LTV) or average margin to contextualize the acceptable CPL.
- Qualification rate : share of leads that can actually be exploited by salespeople.
A useful KPI is actionable: if it doesn't change a decision next week, take it out of the dashboard.
ROI tracking and attribution
Le ROI marketing compares the gain attributed to campaigns to the cost incurred. In practice, attribution is imperfect: combine last-click model for simplicity with "how did you know about us?" » for complex sales. For local SEO, cross-reference positions, Search Console clicks and assisted conversions in GA4.
Conversion rate: segment to understand
Un conversion rate overall hides the problems. Break down by device, geographic area (ex. Bouches-du-Rhône vs. out of region) and page intent. A Google Business listing that sends to a slow page can drop the rate even if the ad is well targeted.
Rhythm of reporting and governance
A monthly export arrives too late to adjust bids or creatives. Choose a light weekly reporting (alerts on CPL anomalies, GA4 objectives) and a monthly strategic review. Document the hypotheses ("we are testing a new CTA") to reread the curves with hindsight.
CL WEB helps companies in the South establish the right framework: specific conversion events, dashboards that are readable for management, and trade-offs between acquisition and loyalty. The data is used to invest better, not to drown the meeting in curves.